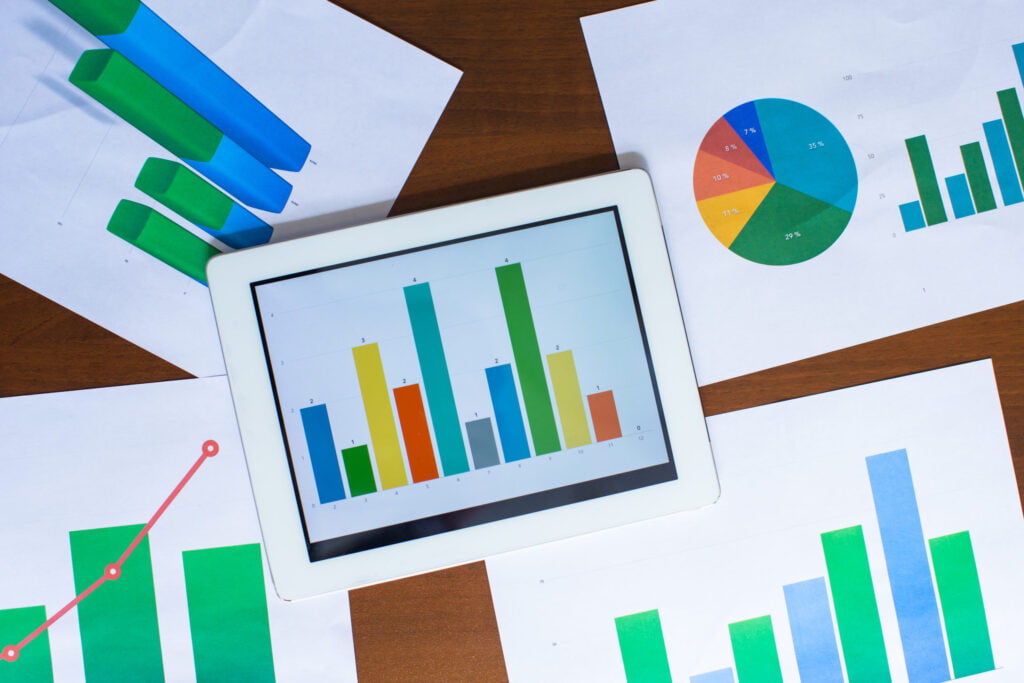
Financial charts visually represent the financial performance of a company, sector, or market. They can be used to help make smart investment decisions, as they allow investors to compare and analyze different investments easily. With the help of financial charts, investors can identify trends and spot opportunities for potential investments. This blog will discuss how to use financial charts to make smart investment decisions and the importance of understanding the different types of financial charts. Keep reading to learn more.
What are finance charts used for in investing?
Financial charts allow you to see how a company has been performing over time, compare its performance to its competitors, and identify potential warning signs. Financial charts can be used for both long-term and short-term investing purposes. Long-term investors typically use financial charts to get an idea of how a company has been performing over time and identify any significant changes in trends. Short-term investors may use financial charts to find opportunities to buy or sell stocks based on how a company is currently performing.
What are the different types of stock charts?
Stock charts are a visual representation of price movements over time and can help determine when to buy or sell stocks. There are a variety of charts that investors can use, including bar charts, line charts, and candlestick charts. Each type of chart has its own set of information that can help make investing decisions.
- Bar charts show a security’s high, low, and closing prices over a specific time period. This information can help investors see when security is reaching new highs or lows and whether it’s experiencing positive or negative momentum.
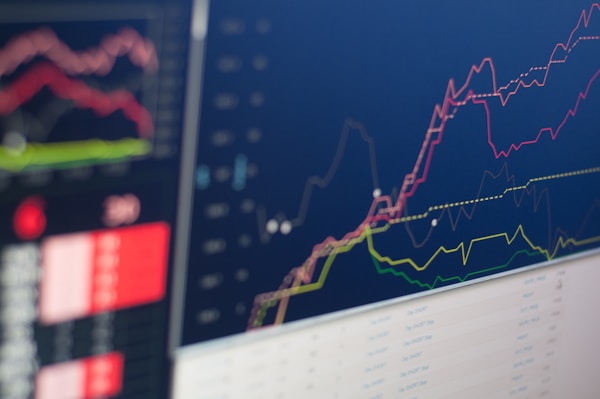
- Line charts track the price movement of a security over time by connecting the closing prices. This information can help investors identify trends in the market and determine whether a security is trending upwards or downwards.
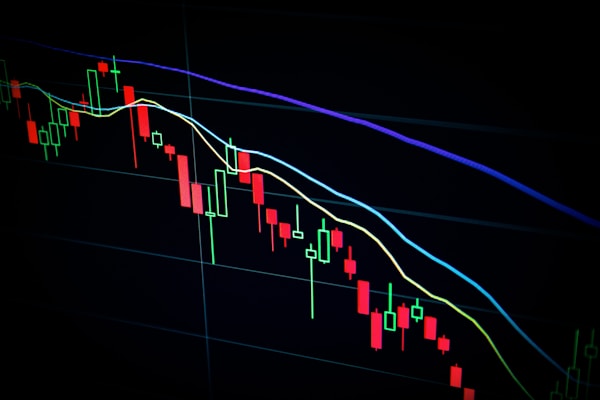
- Candlestick charts show the opening, high, low, and closing prices for security over time and how much volume was traded during that period. This information can help investors see price movement patterns and determine when buying or selling opportunities may occur.
How are risk and reward measured on finance charts?
Financial charts are used to track the performance of a security or portfolio over time. The most common type of financial chart is the line chart, which plots the price of a security or portfolio overtime on a linear scale. A line chart can help you measure risk and reward potentials.
Risk is measured by looking at how much a security or portfolio’s price has increased over time. The greater the price movement, the higher the risk. Reward potential is measured by how much the price has increased from its starting point. The greater the increase, the higher the reward potential.
Line charts can also identify trend lines, support, and resistance levels. A trend line is a straight line that connects two or more points on a chart and represents the general direction of prices. Support levels are points where prices have stopped moving lower, and resistance levels are points where prices have stopped moving higher.
What can stock charts help you identify?
Charts can help investors spot price reversals before they happen, allowing them to buy or sell stocks at a higher price. Price reversals are shifts in a security’s price trend, typically occurring when a stock has been moving in one direction for an extended period of time. Investors can identify key support and resistance levels, trendlines, and patterns by studying stock charts. Once these levels have been determined, investors can use this information to make informed investment decisions.
There are several reasons why investors should use financial charts when making investment decisions. First, charts can help investors identify trends in the market and spot potential opportunities or risks. Second, charts can help investors better understand the relationship between different financial instruments and how they move in relation to each other. Lastly, charts can help investors time their investments and make more informed decisions. These reasons demonstrate why financial charts are an essential tool for investors.