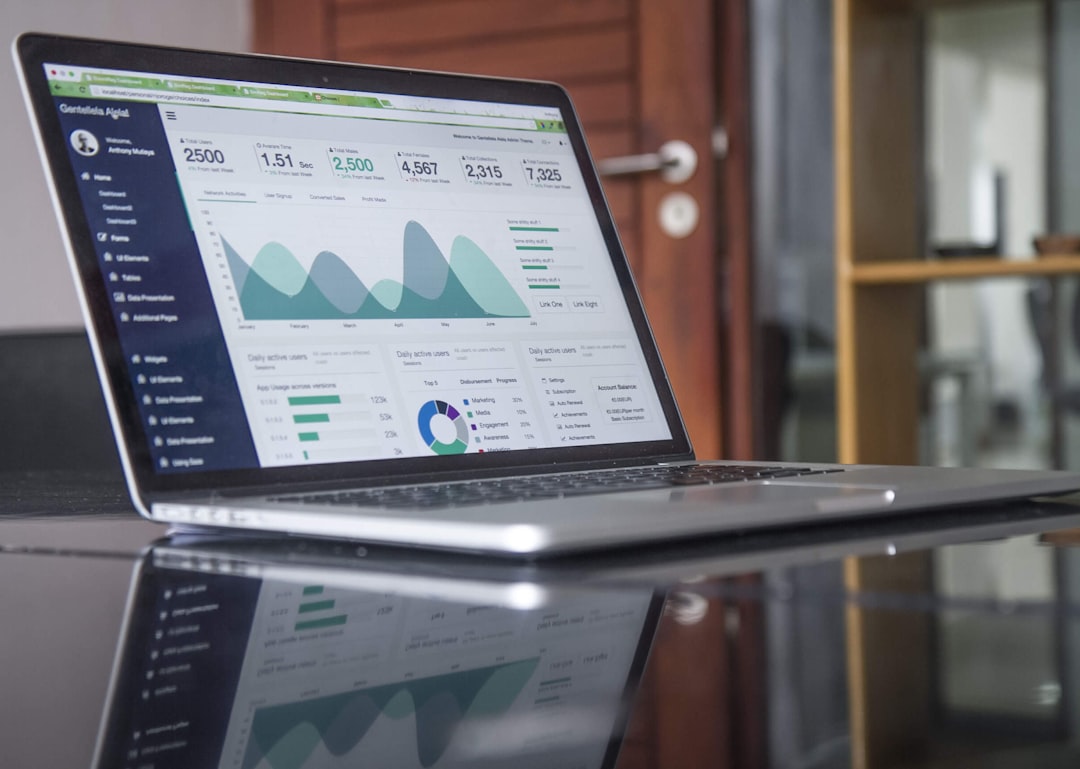
The data analytics definition is the process of gathering, organizing, and analyzing data to help you understand your business and make better decisions. By using data analytics, you can track your progress, identify areas for improvement, and make changes that will help you achieve your goals. Continue reading to learn the steps to harnessing the power of data for the success of your business.
Collect and organize data.

The first step in using data to drive your business decisions is to collect and organize quality data. This includes gathering data from all relevant sources and organizing it in a way that makes it easy to analyze.
You may need to create a data dictionary or data model to help you do this. A data dictionary is a list of all the data elements in your system, along with definitions and data types. A data model is a graphical representation of your data, which can help you see relationships and patterns.
Analyze and interpret data.
Once you have your data collected and organized, you can begin to analyze it. This includes examining the data to identify trends and patterns. You can use various techniques to analyze your data, such as trend analysis, correlation analysis, and cluster analysis. Identify what you want to learn and break it down into smaller questions. Once you have a good understanding of what you’re looking for, you can start to gather the data and look for patterns.
One way to analyze data is to use correlation coefficients. Correlation coefficients measure the strength of the relationship between two variables. You can use correlation coefficients to answer questions like “What is the relationship between my company’s revenue and a number of employees?” and “What is the relationship between customer satisfaction and number of complaints?” To calculate a correlation coefficient, you need two pieces of data: the two variables you’re measuring and the number of data points you have for each variable. You can then use a graphing calculator or software like Excel to calculate the coefficient.
When you have identified trends and patterns, you need to interpret them to see what they mean for your business. This includes understanding the implications and determining how to use them to improve your business. This can be tricky, but there are a few things to keep in mind. First, look for trends. Are there certain times of year when your sales are higher or lower? Are there certain products that are more popular than others? What do your customer demographics look like?
Always make sure you’re looking at the right data and asking the right questions.
Use data to drive decision-making.

Once you have analyzed and interpreted your data, you can use it to make decisions about your business. Data can be used to make decisions about what products to produce, how to market those products, where to allocate resources, and so on. This includes using the data to determine what products or services to offer, how to price your products or services, how to market them, and how to improve your operations. The data should not be the only factor you consider when making decisions, but it should be one of the factors you consider.
Use data to monitor results.
Once you have made decisions based on your data, you need to monitor the results to see how they are working. This includes tracking sales, profits, and other key metrics. If the results are not what you expected, you can use the data to help you determine why and make adjustments.
Start by looking at your sales figures. What items were most popular? Why do you think that is? What items sold the least? Why do you think that is? Next, take a look at your website traffic. What pages were most popular? Why do you think that is? What pages had the least traffic? Why do you think that is? Finally, look at your social media analytics. What posts were most popular? Why do you think that is? What posts had the least engagement? Why do you think that is?
Once you’ve evaluated your results, you can start making data-driven decisions to help your business grow.


